FC Money Manager
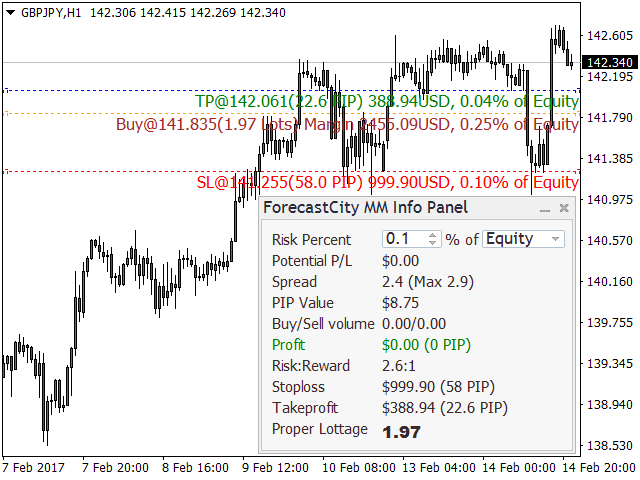
This panel evaluates The volume of transactions and the ratio of risk reward (Risk: Reward) Based on said risk Interest (Risk Percent) And Stop Loss (Stoploss). It also shows the size of the pip (PIP value) Spread (Spread), Potential profit / loss (Potential Profit / Loss), The total profit and the volume of transactions on purchase / sale (Buy / Sell Volume) On the symbol.
Instructions for use
- specify risk
- pressing the up or down arrow to (choose the desired riskRisk Percent), The risk increases or decreases 0.1%. (Default Risk Percent is equal to 0.1%)
- Then choose whether to calculate the volume of transactions on the basis of the amount of funds (Equity) Or available balance (Balance).
When you select "Balance", the actual balance is calculated as (potential available balance + profit / loss).
Potential P / L: The potential gains / losses. This is the amount of possible profit or loss, which can be obtained, the difference between the entry price and the SL.
If SL is located in the lucrative area in the transaction has the potential profit; if bezubytka level, there is no profit or loss; In the remaining case - there is a potential profit.
- Visual determination of the entry points / TP / SL on the graph
Adjust the three lines on the graph to define the properties of the transaction (entry price, SL and TP). These lines are automatically drawn on the graph at the panel on the chart.
The panel is implemented algorithm automatically determine whether a trader wants to buy or sell, according to the following criteria:
- If the SL below the entry price, the proposed purchase.
- If SL above the entry price, the sale is expected.
- TP must be configured accordingly.
To ensure the preservation of capital, all transactions must be installed SL. Therefore, if a transaction is not SL, the whole capital will be at risk!
If the entry price line SL and remove from the chart, they will be created again with the default values. But if you remove the TP line, it will not be created again. To redraw it, you must change the timeframe or symbol graphics. You can also remove the panel with graphics and install it again. In this case, all three lines redrawn, but default.
- That's all! The volume of transactions It is calculated and displayed as "recommended lot size" (Proper Lottage)!
Information panel
- Potential P / L: The calculated value of the potential gain / loss on all open transactions.
- Spread: Current and maximum spread for the current character on the account.
- PIP Value: The size of each pip (no points, also known as Pipette) for the current character in the account currency.
- Buy / Sell volume: The total volume of open transactions for the purchase / sale of the current symbol.
- Profit:The total profit of the open transactions on the current symbol.
- Risk: Reward: risk reward ratio in the format (1: #. #) to risk less profit (# #:. 1) to risk more profit.
- stoploss: Possible loss based on the value SL, the user specified in the account currency and in pips.
- takeprofit: Potential return based on the values of TP, specified by the user in the account currency and in pips.
- Proper Lottage: Calculated lot size for new transactions based on credit and interest risk, which is determined depending on the value of stop loss in pips * pips size.
- The lot size is compared with the minimum and maximum limits per transaction and volume increments.
- Panel avoids overlapping panels built for trading in a single click.
- Under each line displays additional information that describes the required level of available funds, potential profit and loss, as well as their share of assets.
- Descriptions shifted when moving or changing the scale of the chart.
- Settings assets and interest risk are saved for each chart!
- All values are set visually in the display properties no input parameters.
Author
Forecast City

Related posts
Dashboard The DIBS Method DIBS = Daily Inside Bar Setup (daily inside bar) For signal generation system uses the popular candlestick pattern "inside bar"...
Loss Recovery Trading Robot This EA can be used for manual trading as wallpaper advisor or combine with another advisor for opening transactions. Loss...
TradePadMini TradePadMini Panel simplifies the manual trading . This is a more economical version TradePad panel. It takes up less space on the screen,...

No comments:
Post a Comment